

Essential UX Statistics 2025
Why User Experience Is Your eCommerce Lifeline ?
We all here like numbers, right? Especially when they help us make more money. We’ve compiled these essential UX(User Experience) statistics to highlight just how critical user experience is for your eCommerce success. Today’s interfaces need to be fully optimized with consumers in mind, and understanding these trends can help you identify roadblocks in your customer journey and recover lost revenue.
The Hard Truth About UX: Key Statistics Highlights
- 88% of online shoppers say they wouldn’t return to a website after having a bad user experience. (That’s roughly the same percentage of people who wouldn’t return to a restaurant after finding a fly in their soup.)
- 70% of online businesses that fail do so because of bad usability. (Ouch!)
- Only 55% of companies currently conduct any UX testing. (Be in the smart half!)
- You are 279.64 times more likely to climb Mt. Everest than click on a banner ad. (We’re not suggesting extreme mountain climbing as an alternative marketing strategy, but…)
- 53% of mobile site visitors leave a page that takes longer than three seconds to load. (Faster than you can say “where did my customers go?”)
- People form 75% of their judgment on a website’s credibility purely on its aesthetics. (First impressions matter—just like your high school yearbook photo that still haunts you.)
- Bad mobile optimization annoys 48% of users. (Almost as annoying as that person who takes 15 minutes to order at a coffee shop.)
The Real Cost of Poor User Experience
Revenue Impact
67% of mobile users say they’d rather reward a mobile-friendly site by buying a product or service there than from a competitor.
This isn’t just about making things “look nice”—it’s about your bottom line. When your website frustrates customers, they don’t just leave—they actively choose your competitors. At Webeyez, we’ve seen firsthand how fixing critical UX issues can recover substantial revenue that was literally walking out your digital door.
The Ripple Effect of Bad UX
44% of shoppers will tell their friends about a bad online experience.

Bad News Travels Fast
Bad news travels fast, especially in the digital age. One frustrated customer becomes an ambassador of negativity, spreading the word about their poor experience to friends, family, and sometimes (gulp) social media. Consider this: for every customer who complains, 26 others remain silent and simply never return. That’s a lot of invisible revenue just disappearing.
The Mobile Experience Gap
85% of adults think a business’s mobile website should be as good as or better than its desktop version.
Yet 96% of consumers have encountered sites that weren’t properly optimized for mobile devices. This disconnect is costing eCommerce businesses billions in lost sales annually. If your mobile experience isn’t frictionless, you might as well be putting up a “Closed for Business” sign for more than half your potential customers.
Technical Issues: The Silent Conversion Killers
Loading Time: The 3-Second Rule
53% of mobile site visitors abandon pages that take longer than three seconds to load.
If your website was a physical store, slow loading would be like making customers wait in line just to enter the building. Every second counts—literally. Each one-second delay in page response can result in a 7% reduction in conversions. For an eCommerce business making $100,000 per day, that single second could cost $2.5 million in lost sales every year!
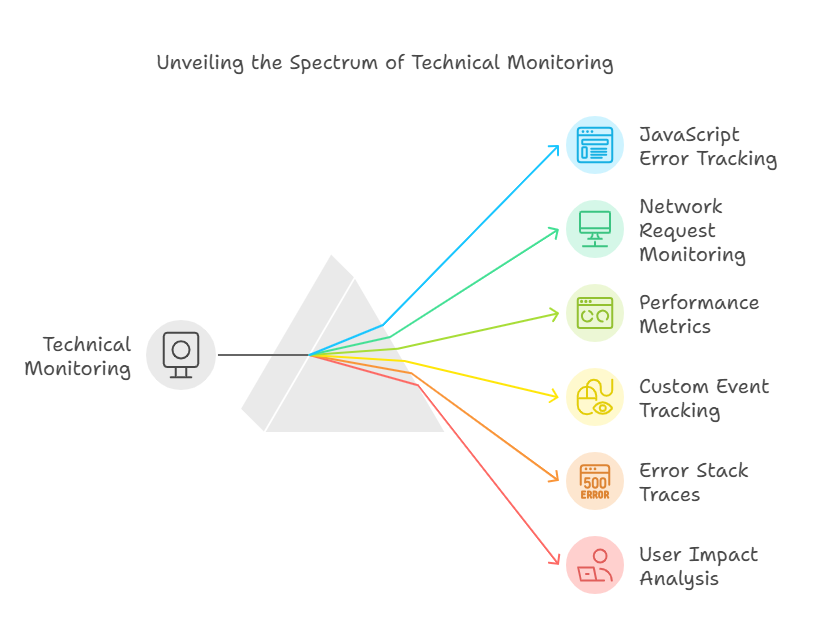
At Webeyez, we call these “technical anomalies,” and they’re often invisible without proper monitoring. Your developers might not even know these issues exist until they’ve already cost you significant revenue.
Error Pages & Broken Journeys
88% of online consumers are less likely to return to a site after a bad experience.
404 errors, payment processing failures, coupon code glitches, and “add to cart” failures are just a few of the technical gremlins that can sabotage your customer journey. These aren’t just minor inconveniences—they’re conversion killers that directly impact your bottom line.
The Psychology of Good UX
Trust Factors
94% of people don’t trust outdated websites.
First impressions happen fast in the digital world. Within 50 milliseconds, users form an opinion about your website that determines whether they’ll stay or leave. Trust is the currency of eCommerce, and poor user experience is like showing up to a job interview wearing pajamas—it sends all the wrong signals.

First Impression Is Priceless
Content Consumption Patterns
On an average site, readers dedicate 66% of their attention to content below the fold.
The way users interact with your site has evolved. Modern customers prefer scrolling to clicking, which means every element of your page—from top to bottom—needs to be optimized for engagement and conversion. Time.com’s bounce rate dropped 15% after adopting continuous scroll, proving that these small UX changes can have major impacts.
Mobile UX: No Longer Optional
The Multi-Device Reality
Around the world, consumers regularly use an average of 2.23 devices simultaneously.
Your customers are checking out your product on their phone while watching TV, or adding items to cart on a tablet while getting price comparisons on their laptop. If your experience isn’t consistent and optimized across all devices, you’re creating friction that leads to abandoned carts.
The Mobile Optimization Mandate
67% of mobile users say they’d rather reward a mobile-friendly site by buying a product or service there than from a competitor.
The shift to mobile isn’t coming—it’s already here. Four out of five users access online shops on their smartphones, and 52% of users said they’re less likely to engage with a company that doesn’t use responsive mobile design. Can your business afford to ignore more than half of potential customers?
Data-Driven UX: Measure What Matters
Testing Gap
Only 55% of companies currently conduct any UX testing, yet 85% of UX issues can be detected by testing with just five users.
The good news? You don’t need massive resources to identify the critical issues impacting your customers. Small, focused testing can reveal the majority of problems affecting your conversion rates. The key is knowing what to look for and how to prioritize fixes based on revenue impact.
Development vs. Design Costs
Resolving problems in the development phase costs 10 times as much as fixing them in design, and this balloons to 100 times as much for products already released.
Proactive UX monitoring isn’t just good practice—it’s good business. Identifying and resolving issues early saves exponentially more money than waiting until they impact your customers and revenue.
How Webeyez Helps Solve These UX Challenges
Understanding these statistics is one thing—actually fixing the issues is another. This is where Webeyez comes in as your eCommerce ally. Our platform is designed specifically to help you:
- Identify conversion killers on your website and quantify their impact on revenue
- Monitor in real-time for technical anomalies and site performance issues
- Prioritize fixes based on revenue impact, not just technical severity
- Record and replay customer sessions to see exactly where friction occurs
- Engage customers in the moment to prevent abandonment
- Quantify revenue opportunities so you can make data-driven decisions
Ready to see how much revenue you’re losing to poor UX? Contact Webeyez today for a free health check of your website’s roadblocks.